
Introduction
Magnitude is a simulation tool prototype, developed by Mathieu Magnaudet and Laetitia Bornes, as part of Laetitia Bornes’ thesis. This tool allows, among other things, the modeling of direct and indirect environmental impacts of digital products or services. It was designed to enable collaborative construction of a simplified model based on mixed data (system data, user surveys, expert assumptions). The objective is to enable involved stakeholders (decision-makers, designers, policymakers, citizens, etc.) to better understand the dynamics of these impacts by interacting with the model, and to identify and test mitigation strategies. Comparing multiple simulations (representing various scenarios and strategies) helps identify realistic and impactful lever combinations.
Download
Below are compressed folders for downloading Magnitude with either a Mac or Windows operating system (Linux is unfortunately not supported). In both cases, you need to download the corresponding folder and decompress it. Please note, this is just a prototype: it is not licensed, which may trigger your computer (and navigator)’s protection. Therefore, you may need to force the download, and you should follow the steps below.
Windows Installation
- After downloading the compressed folder « magnitude_win, » you need to decompress it (go to the « decompression tool » tab in your file explorer and click « extract all »).
- Enter the sub-folder named « magnitude_win. »
- Open the file named « magnitude.bat » (not « magnitude.exe ») by right-clicking and selecting « open. »
- You will likely see a warning window: select « more info » and click « run anyway.”
You’re done (hopefully)! Two windows will open, and you don’t need to worry about the terminal window. You now have access to the tool and can reopen it from this folder whenever you want!
Mac Installation
- After downloading the compressed folder « magnitude_mac, » double-click to decompress it.
- Open the file named « magnitude.app » by right-clicking and selecting « open. » You will likely see a warning window the first time: close the window (by clicking « Ok »).
- Try again (right-click + open): you should now have a popup that allows you to open the prototype (it may require several attempts before it works).
- You’re done (hopefully)! You now have access to the tool and can reopen it from this folder whenever you want 🙂
As it is a research prototype, some systems may not allow installation even with these manipulations. In this case, unfortunately, we can’t assist you further and suggest trying on a different computer.
Presentation of the prototype
Here is a quick video presentation showcasing the features of the prototype. In this video, we present a simple example of calculating transportation emissions. First, we multiply the average distance traveled per month (constant) by the carbon intensity (which decreases over time, assuming the transportation system becomes less energy-intensive). Then, we add a feedback loop (quite optimistic): we assume that the higher the total CO2 emissions, the more awareness of the problem spreads (with some delay), and the more behaviors adapt and reduce the average distance traveled per month.
Model examples
The two models below (also available in the « diagram » folder of the prototype) were created with Magnitude and represent the impacts of the Vinted platform. The data used is relatively simplified (often utilizing average values or hypotheses). Feel free to challenge the hypotheses and build your own version of the model. The objective is to compare scenarios (in trend and order of magnitude) rather than produce precise values. The first model (VintedModel1) has a very simplistic and linear mechanism for the evolution of the number of users (sellers and buyers), while the second model (VintedModel2) has a more elaborate mechanism for the evolution of the number of users (using a data table with the custom transformation block).
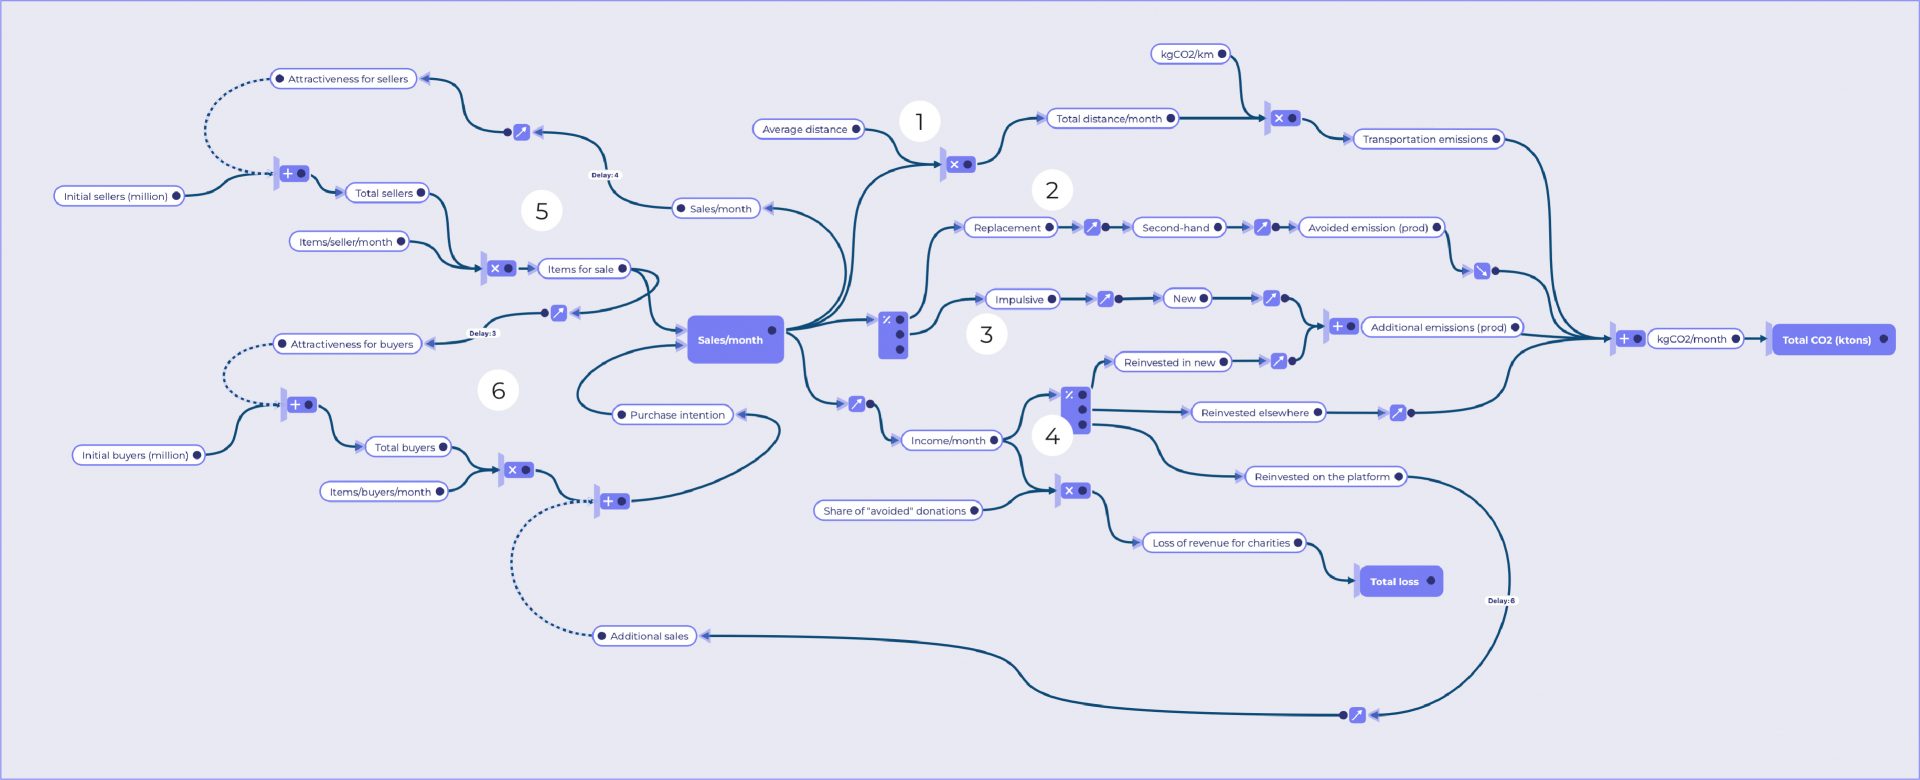
In Figure 1, branch (1) focuses on estimating emissions related to parcel transportation, while branch (2) estimates avoided production emissions. In 39% of cases, users reported that if they hadn’t bought on Vinted, they would have purchased a new garment. Among these cases, approximately 72% are truly second-hand (not indicated as new or almost new). Branch (3) estimates additional production emissions due to compulsive purchases. Branch (4) represents how sellers plan to use their sales revenue. 9% will use it to buy new items, 61% will spend it on the Vinted platform with some delay, and 30% are unsure. Loop (5) illustrates how the number of sales affects the number of future sellers, making the platform more attractive for sellers. Loop (6) shows how the number of products for sale affects the number of future buyers, making the platform more attractive for buyers.
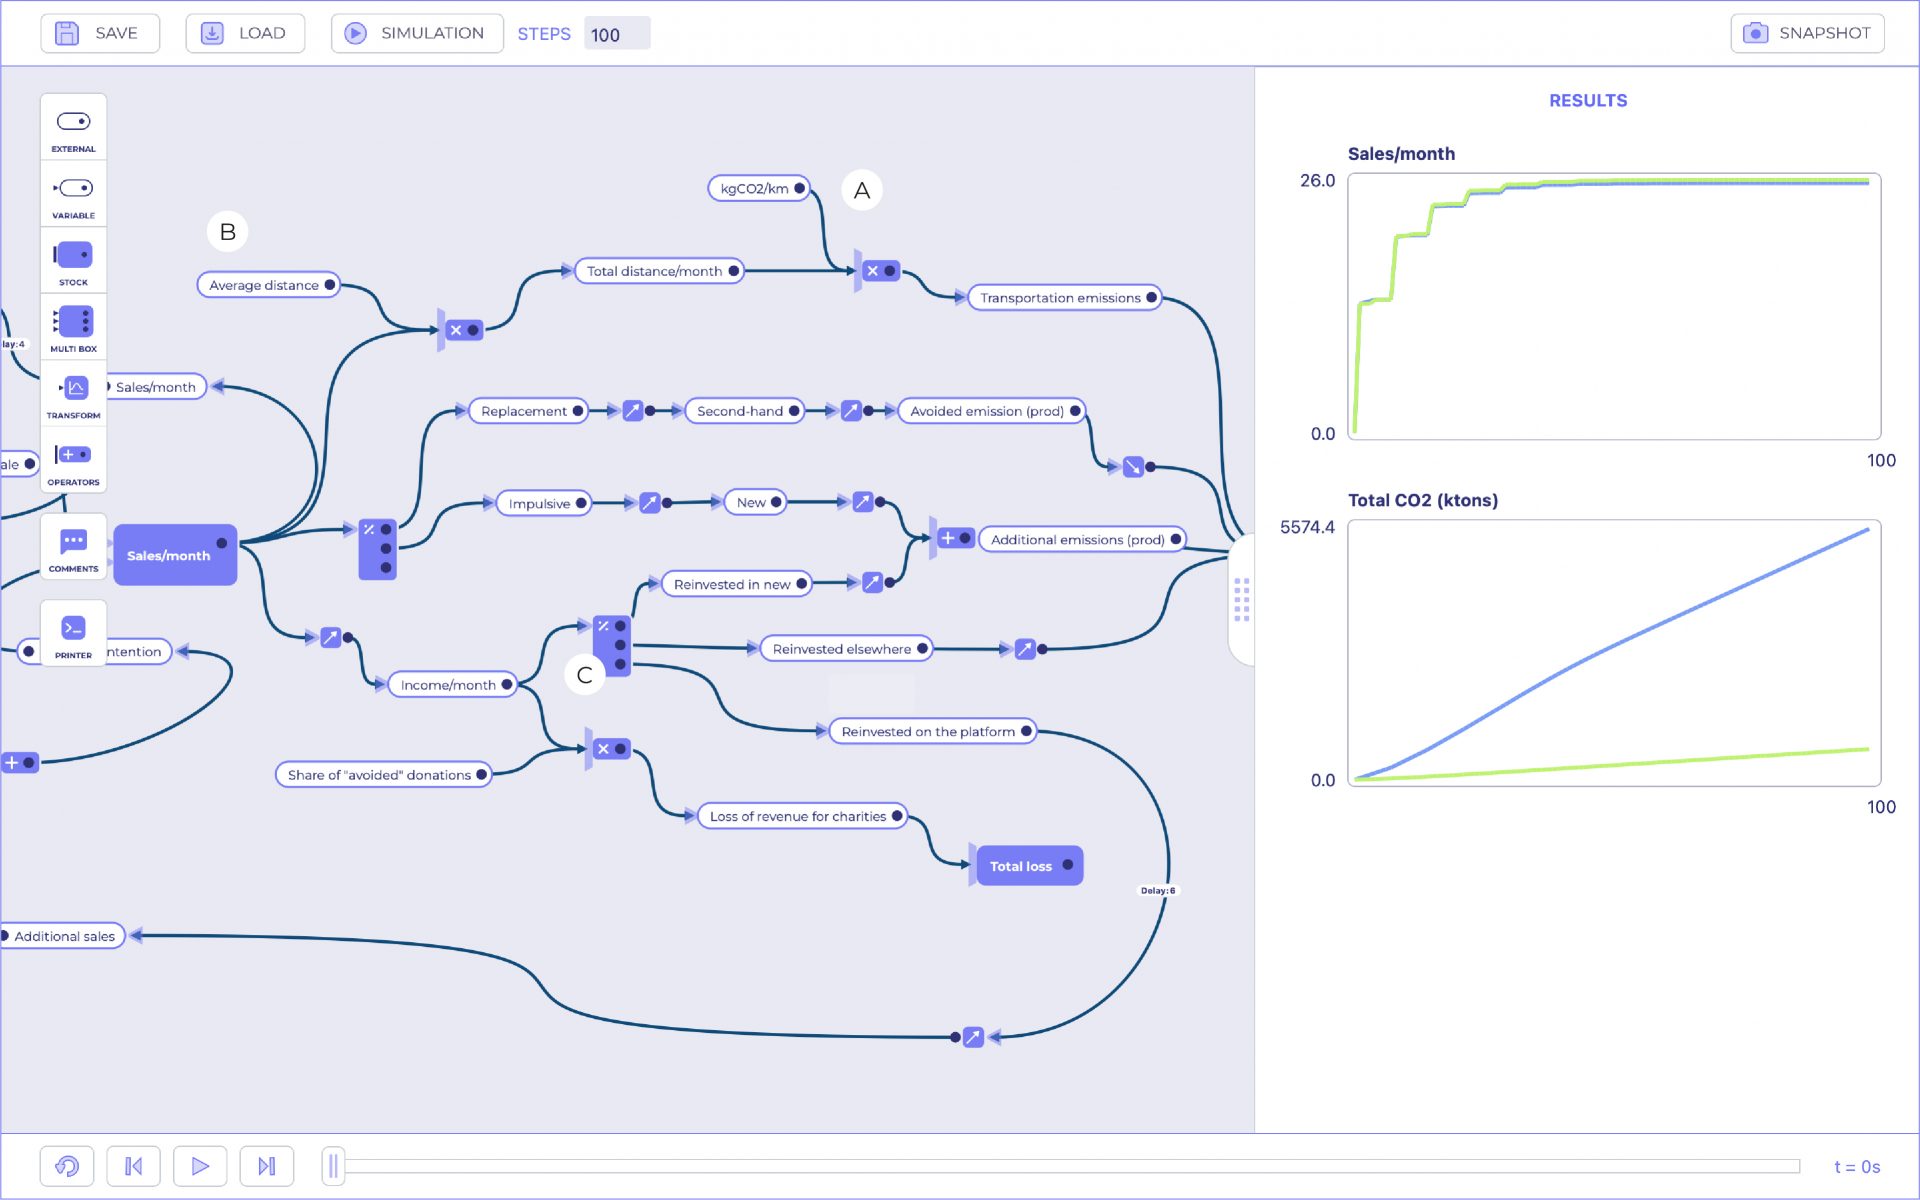
In Figure 2, we compare the impact on sales and GHG emissions (in CO2 equivalent) between two design strategies. The violet curve illustrates a strategy only focused on reducing carbon intensity of transportation (A). The green curve depicts a scenario where a filter is used to limit the distance packages travel (B), and sellers are encouraged to spend their earnings on low-carbon options (C).
Reminder of the components that make up a model
External variables
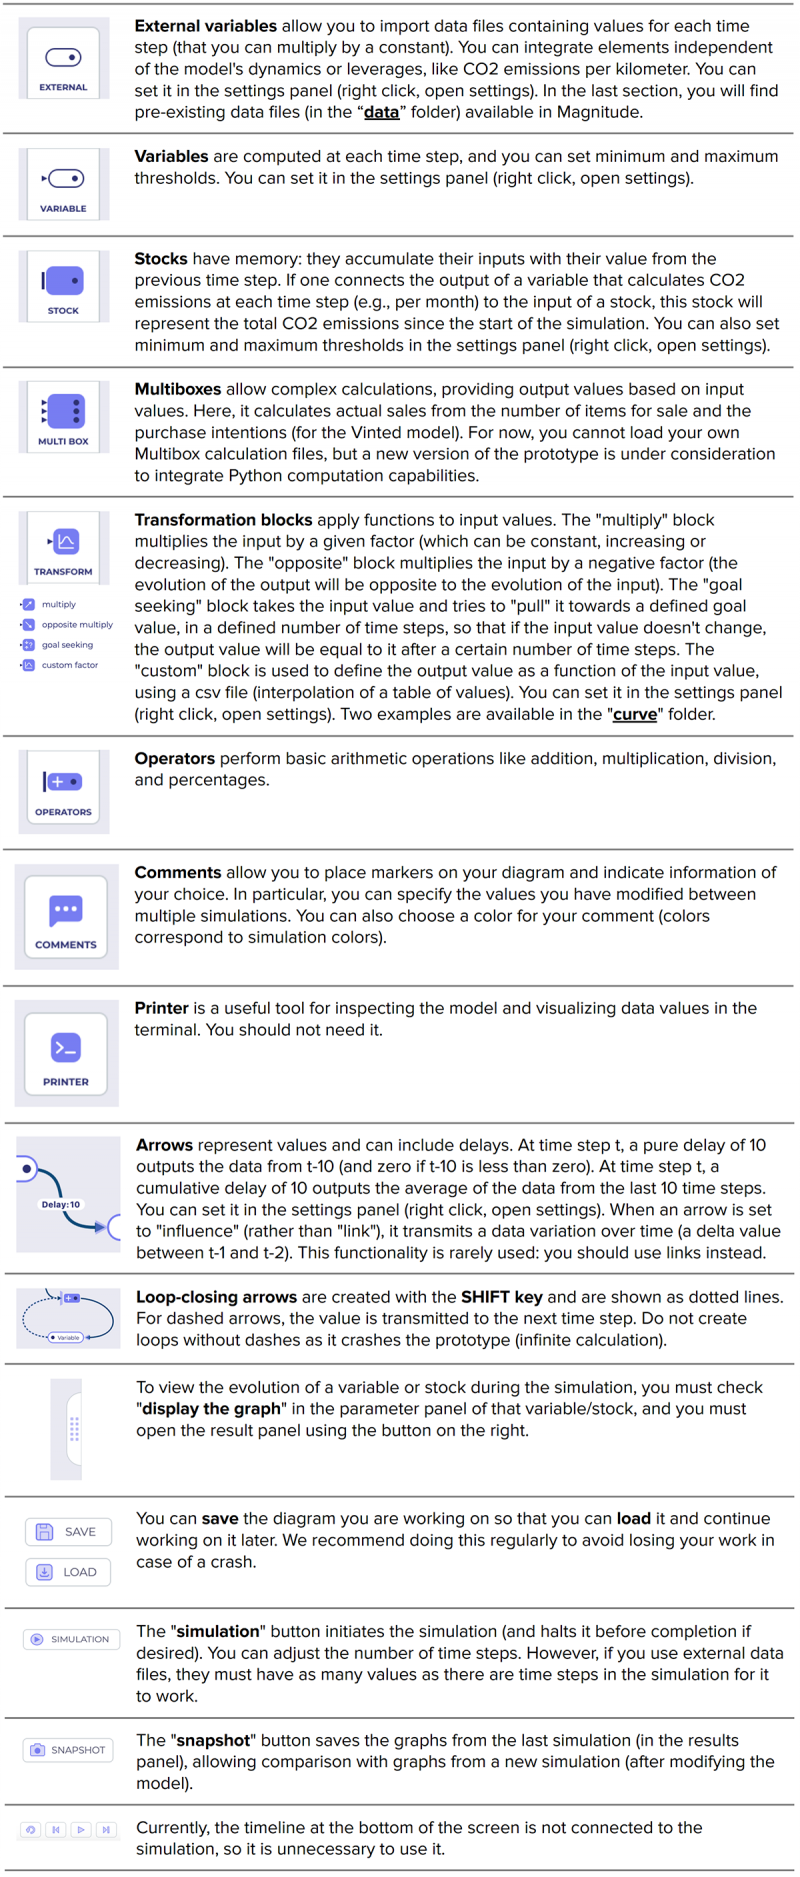
External variables allow you to import data files containing values for each time step (that you can multiply by a constant). You can integrate elements independent of the model’s dynamics or leverages, like CO2 emissions per kilometer. You can set it in the settings panel (right click, open settings). In this section, you will find some of the pre-existing data files (in the “data” folder) available in Magnitude.


also:
data/from25to100.dat
data/from50to100.dat
data/from1to2.dat
data/from1to4.dat

also:
data/level0to1_10.dat
data/level0to1_30.dat
data/level0to1_50.dat


also:
data/from100to25.dat
data/from100to50.dat

also:
data/level1to0_10.dat
data/level1to0_30.dat
data/level1to0_50.dat